Foreign trade turnover. Modern structure of exports and imports in Russia Commodity structure of exports and imports in the Russian Federation
The fall in world energy prices
As well as international economic sanctions that have been in force against the Russian Federation since 2014, accompanied by a Russian embargo on a number of import items in response, could not but affect the dynamics of indicators foreign trade RF this year.
According to the data of the Central Bank of Russia, cited by Rosstat, in January-May 2016, the Federation's foreign trade turnover amounted to almost $172 billion, which is only 75.5% of the level for the same period last year. Export - $104.3 billion (less than 69% from January-May 2015) and import - $67.6 billion (less than 89%). The balance is positive, at the level of $36.7 billion. It should be noted that this figure has collapsed by more than two times compared to the balance for the same period of the 15th year ($75.4 billion). The numbers speak for themselves. Russia's foreign economic activity is curtailing.
The topic of this article is
analysis of individual items of export, import and foreign trade balance of the Russian Federation
for January-May 2016. The basis for the assessment is the information of the Federal Trade Service (FTS), which differs somewhat from the information of the Central Bank, but is accepted by experts as more accurate. Differences in gross values, within a few percent.
Russian export

It follows from the above diagram that despite the decrease in the scale of foreign trade, in relative terms, little has changed in the structure of Russian exports. Almost a quarter is accounted for by crude oil, natural gas - more than 12%. In total, for hydrocarbons - about 37%. Over 1/3!
Another export article that gives more than 10% of foreign exchange earnings is metallurgical products. Also, quite a raw component.
Russian import

Here, too, everything is quite predictable. Almost half (44.5%) are manufactured goods: instruments and equipment, mechanical engineering, transport. All that Russia has not learned to do. And will he learn... And under the sanctions, not everything is still possible and you can buy something. Even for petrodollars. Imported chemical products also have a high share - almost 20%.
Foreign trade turnover of the Russian Federation
Nearly $170 billion of total foreign trade turnover (data from the Federal Customs Service) was distributed by country as follows:

The main trading partner of the Russian Federation is the European Union, relations with which are now oh, how difficult. He has almost 44%. The main "European Union" part belongs to Germany - almost $15 billion out of $74.5 billion (20.1%). 59% of the turnover with the EU, in addition to Germany, is provided by the Netherlands, Italy, France and the UK. Kind, old and very developed Western Europe. Its "economic heart".
The share of China is 13.4%. It is growing, but I would like the pace to be higher. Nevertheless, "Celestial Empire" overtook its closest neighbors - the CIS with their 12.2%. The traditional largest partner-neighbors are Belarus (5.2% of the total turnover) and Kazakhstan (2.7%).
The United States looks like an outsider against this background - only 4.1%. The Americans were even ahead of the Belarusians. Why be surprised. The United States is the main ideologist of the anti-Russian sanctions policy. And it will end, apparently, still very, very soon.
Source: Ministry of Economic Development of Russia
Trade
The EU is the main trading partner of Russia, which accounted for 49.2% of Russian trade turnover in January-April 2014 (of which 70.6% were exports and 29.5% - imports). Russia, for its part, is one of the top three EU partners (after the US and China).
In January-April 2014, the volume of trade between Russia and the European Union decreased by 3.4% compared to January-April 2013 and amounted to 103.2 billion US dollars.
The volume of Russian exports decreased by 2.7% and amounted to 91.2 billion US dollars, while Russian imports decreased by 5.0% to the level of 38.9 billion US dollars (compared to January-April 2013. ).
The positive balance of Russia in trade with the EU countries in January-April 2014 amounted to 52.3 billion US dollars.
| 2008 | 2009 | 2010 | 2011 | 2012 | 2013 | January-April 2013 | January-April 2014 | |
|---|---|---|---|---|---|---|---|---|
| turnover | ||||||||
| EU | 382,4 | 236,3 | 307,0 | 394,0 | 410,3 | 417,7 | 134,8 | 130,2 |
| Rates of growth % | 35,1 | -38,2 | 29,9 | 28,3 | 4,1 | 1,9 | - | - 3,4 |
| The share of the EU in the volume of foreign trade of Russia | 52,0 | 50,4 | 49,1 | 47,9 | 48,4 | 49,0 | 49,6 | 49,2 |
| Around the world | 734,7 | 469,0 | 625,4 | 822,5 | 846,9 | 851,7 | 271,6 | 264,6 |
| Rates of growth % | 33,2 | -36,2 | 33,3 | 31,2 | 3,0 | 0,6 | - | - 2,6 |
| 100,0 | 100,0 | 100,0 | 100,0 | 100,0 | 100,0 | 100,0 | 100,0 | |
| TS | 60,1 | 69,6 | 66,2 | 19,3 | 16,5 | |||
| Rates of growth % | 35,2 | 15,8 | - 5,2 | - | -14,3 | |||
| Share in foreign trade volume | 7,3 | 8,2 | 7,8 | 7,1 | 6,2 | |||
| CIS | 106,3 | 68,6 | 91,3 | 124,3 | 129,2 | 121,9 | 37,4 | 35,3 |
| Rates of growth % | 29,0 | - 35,5 | 33,0 | 34,2 | 3,9 | - 5,9 | - | - 5,5 |
| Share in foreign trade volume | 14,5 | 14,6 | 14,6 | 15,1 | 15,2 | 14,3 | 13,8 | 13,3 |
| APEC | 149,6 | 97,1 | 145,2 | 195,9 | 200,7 | 208,5 | 66,0 | 68,0 |
| Rates of growth % | 40,2 | - 35,0 | 49,8 | 35,3 | 2,4 | 3,9 | - | 2,9 |
| Share in foreign trade volume | 20,4 | 20,7 | 23,2 | 23,8 | 23,7 | 24,5 | 24,3 | 25,7 |
| Export | ||||||||
| EU | 265,9 | 160,9 | 211,4 | 266,5 | 277,9 | 283,4 | 63,8 | 91,2 |
| Rates of growth % | 35,7 | - 30,5 | 31,0 | 26,0 | 4,2 | 2,2 | - | -2,7 |
| EU share in Russian exports | 56,9 | 53,3 | 53,3 | 51,6 | 52,7 | 53,5 | 54,5 | 53,5 |
| Around the world | 467,6 | 301,7 | 396,4 | 516,7 | 527,1 | 530,1 | 172,0 | 170,6 |
| Rates of growth % | 33,0 | - 35,5 | 31,4 | 30,0 | 2,0 | 0,6 | - | - 0,8 |
| Share in export volume | 100,0 | 100,0 | 100,0 | 100,0 | 100,0 | 100,0 | 100,0 | 100,0 |
| TS | 39,0 | 43,2 | 40,3 | 12,2 | 10,8 | |||
| Rates of growth % | 31,5 | 10,8 | - 7,2 | - | - 11,5 | |||
| Share in export volume | 7,5 | 8,2 | 7,6 | 7,1 | 6,3 | |||
| CIS | 69,6 | 46,8 | 59,6 | 79,4 | 81,7 | 76,8 | 24,1 | 23,4 |
| Rates of growth % | 32,7 | - 32,9 | 27,4 | 31,3 | 2,9 | - 6,4 | - | - 2,9 |
| Share in export volume | 14,9 | 15,5 | 15,0 | 15,4 | 15,5 | 14,5 | 14,0 | 13,7 |
| APEC | 60,6 | 45,3 | 67,2 | 92,5 | 91,4 | 99,3 | 31,0 | 34,7 |
| Rates of growth % | 40,9 | - 24,7 | 48,6 | 38,3 | - 1,2 | 8,1 | - | 12,1 |
| Share in export volume | 12,9 | 15,0 | 16,9 | 17,9 | 17,3 | 18,7 | 18,0 | 20,3 |
| Import | ||||||||
| EU | 116,5 | 75,4 | 95,5 | 127,5 | 132,3 | 134,2 | 41,0 | 38,9 |
| Rates of growth % | 33,6 | - 35,3 | 26,8 | 33,5 | 3,7 | 1,3 | - | - 5,0 |
| EU share in Russian imports | 43,6 | 45,1 | 41,7 | 41,7 | 41,4 | 41,7 | 41,2 | 41,4 |
| Around the world | 267,1 | 167,3 | 228,9 | 305,8 | 319,8 | 321,5 | 99,5 | 94,0 |
| Rates of growth % | 33,6 | - 37,3 | 36,8 | 33,4 | 4,5 | 0,6 | - | - 5,6 |
| Share in import volume | 100,0 | 100,0 | 100,0 | 100,0 | 100,0 | 100,0 | 100,0 | 100, |
| TS | 21,1 | 26,4 | 25,8 | 7,0 | 5,7 | |||
| Rates of growth % | 42,6 | 25,1 | - 2,0 | - | - 19,0 | |||
| Share in import volume | 6,9 | 8,3 | 8,0 | 7,0 | 6,1 | |||
| CIS | 36,6 | 21,8 | 31,7 | 44,8 | 47,5 | 45,2 | 13,3 | 11,9 |
| Rates of growth % | 22,5 | - 40,5 | 44,8 | 39,6 | 6,0 | - 5,1 | - | - 10,3 |
| Share in import volume | 13,7 | 13,0 | 13,9 | 14,6 | 14,8 | 14,0 | 13,4 | 12,7 |
| APEC | 89,2 | 51,8 | 78,0 | 103,4 | 109,3 | 109,1 | 35,0 | 33,2 |
| Rates of growth % | 39,8 | - 41,9 | 50,8 | 32,7 | 5,6 | 0,1 | - | - 5,2 |
| Share in import volume | 33,4 | 30,9 | 34,1 | 33,8 | 34,2 | 33,9 | 35,2 | 35,3 |
Source: Federal Customs Service
Commodity Structure of Russia-EU Foreign Trade in 2013
According to the results of 2013, in the structure of Russian exports to the EU countries, the main share of deliveries falls on the mineral products commodity group (mainly products of the fuel and energy complex) - 85.0% of the total export volume.
The share of metals and products from them is 6.4%, products chemical industry- 3.6%, machinery, equipment and vehicles (1.6%), precious stones and precious metals - 1.4%.
Main export commodities (over 86% of all deliveries): crude oil, oil products (liquid fuels not containing biodiesel, diesel fuel, not containing biodiesel, straight-run gasoline), natural gas, coal, unwrought nickel, diamonds.
The structure of imports is formed by: machinery, equipment and vehicles- 50.6%, products of the chemical industry (22.6%), food and agricultural raw materials (11.2%).
The share of metals and products from them is 5.6%, other goods (mainly furniture) - 3.5%, wood and pulp and paper products - 2.9%, textiles, products from it, shoes (2.2 %).
The main imported goods (largest commodity items): electric power and electrical equipment, electrical household appliances, telephone equipment, cars and trucks, parts and components for them, medicines and blood fractions, food products.
For reference: in the total exports of the EU states, in the context of the main commodity groups the supply of industrial products dominates - 79.1%, mineral raw materials account for 9.9%, food products and agricultural raw materials - 7.5% of the total export volume (hereinafter, statistics from the WTO Secretariat are given).
The United States receives 17.3% of the exports of the EU countries (-0.7 percentage points compared to 2011), China - 8.5%, Switzerland (8.0%), the Russian Federation - 7.3% (+ 1.1 percentage points to the level of 2011), Turkey (4.5%).
The rest of the world accounts for 54.4% of export deliveries. In value terms, EU exports in 2012 (on FOB terms, excluding mutual trade between EU member states) amounted to USD 2,166.8 billion, remaining at the 2011 level.
The structure of imports of EU countries is dominated by industrial products - 53.7% (-6.3 p.p. compared to 2011), 34.6% (+4.4 p.p.) falls on mineral raw materials and fuel and energy products. ), for food and agricultural raw materials - 7.5%.
The largest suppliers of goods to the EU countries are: China -16.2% (-2.7 percentage points compared to 2011), Russian Federation 11.9% (+1.5 p.p.), United States - 11.5% (+0.1 p.p.), Switzerland 5.9% (+0.2 p.p.), Norway - 5.6% (+0.3 p.p.).
Other countries account for 48.9% of EU imports. In value terms, EU imports in 2012 (on CIF terms, excluding mutual trade between EU member states) amounted to USD 2,301.1 billion, a decrease of 4% compared to 2011.
The European Union, as an economic grouping, has a negative balance in trade in goods with the countries of the world. According to the results of 2012, the EU foreign trade deficit amounted to -134.3 billion US dollars, or 3% of the total trade turnover between the EU and the countries of the world (in 2011, the negative balance of the European Union amounted to 226.5 billion US dollars, or 5% of the volume of trade European Union).
The coverage ratio of imports of EU countries by exports in 2012 amounted to 0.94 (in 2011 - 0.91).
According to the results of 2012, the EU states rank first in trade in services with the countries of the world in terms of exports (830.6 billion dollars, the share in world exports of services is 24.80%) and imports (651.1 billion dollars, the share - 20.13%), and have a positive balance (+179.5 billion dollars).
In the export of services, the largest share (62.7%) falls on the sector of other business services, transport services make up 22.2%, tourist services – 15,0%.
In the import of services most of(54.0%) also belongs to the sector of other business services, transport services account for 23.6%, tourism services - 18.7%.
At the end of 2012, the EU member states reduced the overall balance of trade in goods and services with a positive balance of +45.2 billion dollars (in 2011, a negative balance of about -76.5 billion dollars was recorded in trade in goods and services of the European Union. ).
| TN VED code | Name of product | Export | Import | ||||
|---|---|---|---|---|---|---|---|
| billion US dollars | Oud. the weight (%) | Index 2013/2012 | billion US dollars. | Oud. the weight (%) | Index 2013/2012 | ||
| 01 – 24 | food products and agricultural raw materials | 2,3 | 0,8 | 100,1 | 15,2 | 11,3 | 105,8 |
| 25 – 27 | mineral products, including: | 240,6 | 85,0 | 104,3 | 1,3 | 0,9 | 89,7 |
| 27 | mineral fuels, petroleum and products of their distillation | 239,5 | 84,6 | 104,3 | 0,9 | 0,7 | 87,3 |
| 28 – 40 | chemical industry products, rubber | 10,3 | 3,6 | 98,6 | 30,3 | 22,6 | 107,1 |
| 41 – 43 | raw hides, furs and products made from them | 0,4 | 0,1 | 104,6 | 0,4 | 0,3 | 95,9 |
| 44 – 49 | wood and pulp and paper products | 2,4 | 0,9 | 110,2 | 3,8 | 2,9 | 100,9 |
| 50 – 67 | textiles, textile products, shoes | 0,2 | 0,1 | 116,1 | 2,9 | 2,2 | 105,6 |
| 68 - 70, 91 –97 | other goods | 0,4 | 0,1 | 103,3 | 4,7 | 3,5 | 101,3 |
| 71 | pearl, gems, metals | 3,8 | 1,4 | 58,0 | 0,2 | 0,2 | 105,2 |
| 72 – 83 | metals, products from them | 18,2 | 6,4 | 88,7 | 7,5 | 5,6 | 103,0 |
| 84 – 90 | machines, equipment, vehicles | 4,6 | 1,6 | 122,5 | 67,9 | 50,6 | 97,4 |
| Total | 283,2 | 100,0 | 102,1 | 134,2 | 100,0 | 101,0 | |
Economic processes in Russia are complex and ambiguous. In the first half of the 1990s, the Russian economy experienced a deep recession, caused by the consequences of a large-scale transition from a centralized economy to a market economy, but at the same time significantly exacerbated by a number of political factors. In terms of its foreign economic potential, Russia has lagged far behind many countries in the world community. Since the second half of the nineties, a certain revival of the Russian economy began, but, unfortunately, it was due not to the modernization of production, but to the use of international loans to organize production and export abroad natural resources, for the purchase of consumer goods in other countries.
Only with the beginning of the 21st century did a real recovery begin in the Russian economy, financial stabilization appeared, and the living standards of the population began to rise. However, the appearance of these positive results is largely due to the favorable conjuncture of world energy prices.
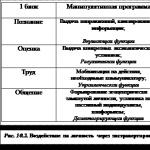
Under such conditions, the political goals and objectives of the state become a particularly important motive for all foreign economic activity. They significantly influence the choice of regional directions and specific partners for foreign economic relations, on the nature and scope of relations with various countries, on the forms of using international cooperation in the interests of the socio-economic development of Russia. The study of these aspects of the interaction between politics and economics in external activities the Russian state is of current importance. It allows a deeper understanding of the interaction of the country's internal development with the possibilities of its international activity, to evaluate the effectiveness of foreign economic activity from the standpoint of national interests Russia.
On the whole, despite the remaining tension in the world financial markets, the situation in Russia's foreign trade was characterized by positive trends. However, some unfavorable signs in macro indicators touched the foreign economic sphere. This is a rapid growth in imports, mainly due to the growth in physical volumes.
According to the WTO rating, according to preliminary data, the Russian Federation ranked 12th in the world in terms of the value of exports of goods - $ 355 billion. At the same time, the nominal annual growth rate increased by 17%, and the real one - by less than 6%. The share of Russia in international exports amounted to 2.6%. In terms of the value of imports of goods ($223 billion, the growth rate is 35%), Russia moved up to 16th position, and its share in total imports reached 1.6%. As a result, in terms of import growth rates, Russia ranked first in the world among the leading trading powers.
Excluding intra-regional trade of 27 EU countries and individual members of the group, Russia ranked 7th in terms of merchandise exports and 10th in terms of imports of goods in the world.
In the rating of countries - providers of commercial services (38 billion dollars, growth rate - 25%), the Russian Federation again took 25th place, and its share was 1.2%. In the field of import of commercial services ($44.3 billion, growth rate - 15%), Russia rose to 16th position in the world, and its share was 1.9% (in 2006, respectively, 18th place and 1.7%).
Foreign economic relations of Russia with the countries of the European Union
In the geographical structure of Russia's foreign trade important place occupied by the European Union. It accounted for 51.6% of Russian trade turnover, the CIS countries - 15.3%, which is higher than a year earlier. During this time, the share of APEC countries increased from 16.4% to 19.1%. Russia's main foreign trade partners among the EU member states remain Germany, the Netherlands and Italy, which account for almost half of Russia's foreign trade turnover with the EU or 28.7% of Russia's foreign trade turnover with non-CIS countries. The main foreign trade partners of Russia among the APEC countries are China, Japan, the USA and the Republic of Korea, which account for 87.7% of the foreign trade turnover with this group of countries or 19.8% of the foreign trade turnover with non-CIS countries. Among the CIS countries, the main foreign trade partners are Belarus, Kazakhstan and Ukraine, which account for 88.1% of foreign trade turnover with the CIS countries.
A significant predominance of Russian exports over imports is typical for trade with the Netherlands, Italy, where the share of exports in the turnover was 91.7% and 75.7%. The same proportions in Russian trade turnover were typical for trade with Poland, Finland, India, Turkey, Belarus and Kazakhstan. Almost equal proportions between exports and imports have developed in Russia's trade with Germany and the United States.
The European Union is Russia's largest trading partner and accounts for more than half of Russia's foreign trade. Investments, services and cooperative ties play an increasingly significant role in our relations. The numbers show a clear positive, but is everything really good here? Analysis of the situation of the upcoming update of the legal framework economic cooperation Russia and the EU indicates the presence of at least two vectors. One is building on the results achieved, removing deadlocks and barriers, expanding opportunities, and further liberalizing economic relations. The other is the politicization of the issues of the Russia-EU partnership. At the same time, the initiative of politicization does not belong to Russia, but to European countries, among which the new members of the European Union stand out in particular. Speaking about the evolution of Russia's foreign policy on economic issues in relation to the European Union as an organization as a whole. It should be noted that the development of the economic dialogue cannot be imagined without taking into account the situation in the world. But if we consider the evolutionary changes in Russia's economic cooperation with the countries that are members of the European Union, then we will see a number of features.
Considering the economic dialogue between Russia and Italy, we can say that Italy is one of the leading trade partners of Russia among Western countries. In recent years, a steady growth trend has continued in Russian-Italian trade and economic relations.
The successful development of bilateral relations is based on a solid economic foundation. In terms of trade turnover, Italy ranks third among Russia's trading partners among Western countries. Bilateral trade turnover amounted to 23.465 billion US dollars, while Russian exports - 19.06 billion US dollars, imports - 4.40 billion US dollars. The main issues of bilateral trade and economic cooperation are considered by the Russian-Italian Council for Economic, Industrial, Monetary and Financial Cooperation. In recent years, high-tech and space industries have become priority areas for bilateral economic cooperation. The commodity structure of Russian-Italian trade has not changed significantly in recent years. In Russian exports to Italy, the main role traditionally belongs to energy carriers. Natural gas continues to be the most important commodity in Russian exports to Italy. In the commodity composition of Russian imports from Italy, the predominant place still belongs to consumer goods. Machinery goods remain the second most important group. The shares of all other commodity groups practically did not change. Monetary and financial cooperation is moving to a new qualitative level. His feature is the transition from the provision of loans under state guarantees to normal interbank interaction, which involves the use financial instruments that do not affect Russia's external debt. One of the priority areas for attracting Italian capital is the electric power industry. One of priority areas economic cooperation is cooperation in the field of high technology.
If we look at Russian-German relations, we can say the following. Germany is Russia's main economic partner in the world. Its share in Russia's foreign trade is more than 10%, and Russia's in Germany's foreign trade is about 2.5%. Mutual trade turnover reached a record high of $32.9 billion. The volume of trade between Russia and Germany increased by 30% and reached $30.9 billion. the German companies E.ON Ruhrgas and BASF, as well as the adoption of the Statement at the highest level on cooperation in the field of energy within the framework of the working visit to the Federal Republic of Germany of the President of Russia Vladimir Putin. Germany is the main creditor of Russia (it accounted for more than 40% of Russian debts under the Paris Club line) and one of the largest investors. In Berlin, a final agreement was signed and implemented with Germany on the early repayment of the balance of the external debt of Russia and the former USSR in the amount of 10.4 billion US dollars (8.14 billion euros). Germany is Russia's most important trading partner, accounting for 13.6 percent of all Russian foreign trade. Russia for Germany, based on absolute financial indicators, is the 10th most important trading partner and trade with it accounts for about 3 percent of total figure. However, the import of Russian energy carriers is of a strategic nature for Germany. Already today, Germany imports more than 30 percent of natural gas and 20 percent of oil from Russia, and according to experts, this share will increase even more in the future. Russia imports many engineering products from Germany.
Speaking about Russian-Belgian relations, one can single out a number of factors that determine the direction of economic cooperation between the two countries. The state and prospects of trade, economic, monetary, financial and investment cooperation between the two countries, relations with international economic organizations, interrelations at the regional and sectoral level are discussed at the meetings of the Mixed Commission for Economic Cooperation between Russia and the Belgian-Luxembourg Economic Union.
Considering Russian-Greek relations in the context of evolutionary development, a number of factors can be noted. There is an upward trend in the field of mutual trade. According to Russian customs statistics, the trade turnover between Russia and Greece amounted to 1429.2 million dollars, including Russian exports - 1262.2 million dollars, imports - 167.0 million dollars. in particular, the implementation of the Agreement on the supply of Russian natural gas to Greece of 1987. Speaking about the development of Russian-Greek economic relations, we can say that their development is aimed at a long-term and stable perspective. Trade turnover is increasing from year to year, which indicates a fairly strong and promising cooperation.
Summing up the results of this paragraph, we have come to a number of conclusions. Speaking about the evolution of Russia's foreign policy on economic issues in relation to the European Union as an organization as a whole. It should be noted that the development of the economic dialogue cannot be imagined without taking into account the situation in the world. Russia's cooperation with the countries that are members of the European Union is a long-term perspective. This type of cooperation is developing very dynamically. As for the evolutionary changes in economic cooperation, we can say that in the conditions of modern world trade, it has a fairly stable development.
Foreign economic relations of Russia with other countries
Considering Russian-American relations, we see that the structure of Russian exports to the United States is traditionally characterized by a raw material orientation. The share of machinery and equipment in it continues to be insignificant. However, US market research and opportunity analysis American companies show: Russia little and badly uses the United States as a supplier new technology and partner in the development of new technologies. There are also real opportunities to expand Russian exports by increasing the supply of a number of goods from a high degree processing, and services. According to the Ministry of Economic Development, goods of the fuel and raw material group dominate in the export of goods from Russia to the United States, primarily oil and oil products (28.0%), which was facilitated primarily by the favorable price situation for these goods. The volume of supplies of oil and oil products in 2007 amounted to 2252.7 million dollars. Ferrous metals accounted for 17.0% of Russian exports to the United States (1367.0 million dollars), aluminum and products from it - 15.4% ( 1239.6 million dollars). The volume of deliveries of inorganic chemistry products (1121.1 million dollars - 13.9% of all Russian exports to the USA), as well as precious and semi-precious stones, metals, natural and cultured pearls (1027.4 million dollars - 12, 7%). A significant share fell on fertilizers (201.0 million dollars), wood and products from it (132.0 million dollars), some products of the machine-building industry (244.3 million dollars).
Russian imports from the USA were dominated by general engineering products and vehicles (about 65%). A significant share in imports was occupied by means of land transport and their parts - 19.1% (1802.1 million dollars), nuclear reactors, boilers, equipment and mechanical devices - 18.5% (1745.0 million dollars). Few, but still, pharmaceutical products ($360.8 million), plastics and products made from them, other chemical products ($337.3 million), perfumes, cosmetics, soap and detergents(280.0 million dollars). A significant share of products imported from the United States last year (more than 12%) was still accounted for by food products, primarily meat and meat by-products, the volume of imports of which amounted to 851.0 million dollars.
According to the United States, trade is hindered by protectionist restrictions imposed by the Russian State Duma. For example, as noted in the annual report of the US Department of Commerce, Russia has slightly reduced tariffs on a number of food products. However, it is still not profitable to import alcohol, medicines and communication devices into Russia due to additional fees and duties, as well as licensing and registration requirements. Huge customs duties and taxes on imported goods "virtually prevent Russian airlines from purchasing foreign aircraft," the report notes. Tariffs and taxes increase the prices of American cars and SUVs by 70%.
If we consider Russian-Chinese relations, it is clearly seen that in recent years Russian-Chinese relations can be characterized as follows: cooperation between our countries in the political, trade, economic, humanitarian fields, as well as in the field of public diplomacy, has received comprehensive and in-depth development. Sino-Russian relations have become one of the most active and lively relations between major powers modern world. The rapid development of China-Russia partnership and strategic cooperation not only brings real benefits, but also plays an important stimulating role in protecting world peace and stability. Bilateral trade and economic ties are also developing rapidly. Economic and investment cooperation has yielded encouraging results. China and Russia see partner development as an opportunity for own development and make every effort to expand technical and economic cooperation. For six years in a row, trade between China and Russia has maintained a rapid growth trend. By 2020, China's total investment in Russia will amount to $12 billion. China's investment volume in Russia has already reached about $2.2 billion.
Consider trade and economic relations between Russia and the countries of Latin America. The activation of relations with the Latin American world is an objective necessity. Moreover, the current situation in the countries of the continent opens up certain prospects for Russia. Diplomatic relations have been established with all 33 sovereign republics of the region. Relations are being restored or established in other areas, primarily in the field of trade and economic cooperation. True, the volume of annual trade barely exceeds $6 billion, which is far from meeting the capabilities of the parties. Russia today is not capable of laying claim to something serious geopolitically in the Southern Hemisphere. But it can also cooperate and expand its niche in areas such as high tech, peaceful use of atomic energy and space exploration, energy, oil and gas production, metallurgy, pharmaceuticals, fish industry, agricultural and road engineering, agro-industrial complex. At least the leading countries of the Southern Cone consider Russia a promising partner.
Economic sanctions of the EU countries??? Well... then --
Both Russia and Belarus have a serious export potential for the growth of trade, and it is better to consider the formation of joint ventures, and the volume of trade can reach up to 90 billion dollars. The expert thinks so Alexey Kuzmin.
The trade turnover between Russia and Belarus can be brought to the level of $50 billion. The President announced this Vladimir Putin at the Forum of Regions of the two countries.
"On the Russian market half of all Belarusian export products are supplied. Last year, trade increased by almost a quarter and reached $32.4 billion. And in January-August of this year, it added another 14.5%, and we are quite capable of bringing mutual trade to the level of $50 billion," the Russian president said.
"The volume of Russian investments in Belarus exceeded 4 billion dollars. Belarusian investments - 716.8 million," he specified.
BelNPP to help exports
It is more than possible to bring the trade turnover to the announced level, Aleksey Kuzmin, a leading expert of the International Institute for Humanitarian and Political Studies, is sure.
“Belarus has a very good export potential, we also have something for export, except for oil and gas. By the way, an important element in the sharp growth of Belarusian exports may be the switching of our energy to the BelNPP as a guaranteeing supplier,” the expert of the FBA “Economics” admitted. today".
Joint ventures
Kuzmin noted the not entirely hopeless situation in the Russian engineering industry, which can also send products to Belarus. At the same time, he stressed, to a greater extent, it is probably worth thinking not about trade, but about joint ventures with their export.
“Belarus, for example, has very good X-ray equipment, and we have a couple of new technologies that have not been used anywhere except for the Large Hadron Collider. These technologies are quite cheap for the mass market, and the joint development of this business in relation to industrial X-ray technology was would be beneficial for both sides. It is a laugh and a sin when we have German or American devices as X-ray security stations in Sheremetev. This is a technique that we know how to do it better than they do, but we have long ruined mass production, and the Belarusians have kept ", - said Alexei Kuzmin.
The markets for X-ray technology are large, with annual multi-billion dollar revenues, but they are updated on average once every five to seven years. "This means the production of thousands of pieces of equipment, and it is not cheap," the expert said.
And fifty and ninety
 If you carefully look in different directions, you can isolate other options.
“We are not very successful now, for example, we played in the project of electric buses for Moscow. But it is not very difficult to bring this to mind, especially since Belarusians have a well-established production of medium-heavy vehicles,” said Aleksey Kuzmin.
With the desire and the right approach, production can be quite competitive. a large number names - both in Belarus and in Russia. "If we talk about numbers, the trade turnover may be fifty billion or ninety billion. This is generally realistic," said the expert of the FBA "Economics Today".
Vladimir Putin called import substitution, industrial cooperation, Agriculture, construction, pharmaceuticals and public procurement.
“Today, Russia and Belarus are facing largely similar problems and challenges, as they say today. Ensuring long-term, sustainable growth, increasing competitiveness in foreign markets. Among the priority sectors where we expect the maximum economic effect, I would like to mention import substitution, industrial cooperation, agriculture, construction, pharmaceuticals, public procurement," the Russian president said.
What does Hjccbz export? This question was asked by every inhabitant of our country. Today, Russia is mainly engaged in the export of energy resources such as oil products, coal and gas. Rolled steel is also exported along with ferrous and non-ferrous metals and minerals. Oil products form the largest share of Russian exports. In addition, the leading export items include natural gas, mineral fertilizers, wood, cars, as well as weapons and various equipment.
Many are interested in what is the role of Yakut diamonds in the export of polished diamonds. More than three hundred million tons of oil, as well as about two hundred and fifty billion cubic meters of gas are exported to the countries of near and far abroad. We will tell you more about the exported products, the structure of Russia's exports and trading partners in our article.
Foreign trade of Russia
Russia's main trading partners today are such countries as China, Poland, Germany, Italy, Turkey, Switzerland, Great Britain, Finland and the USA.
Russia is engaged in providing a significant part of the needs of the Commonwealth of Independent States in oil products and gas. What else does Russia export? Timber, machinery and various equipment. Therefore, for most countries, in particular the neighboring countries, Russia has been and remains an important trading partner.
In 2012 Russia became a member of the World trade organization. In addition, our country is a member of the CIS free trade zone agreement and a member of the customs, as well as the Eurasian Economic Union.
Since 2014, domestic foreign trade has been under significant negative pressure from the foreign trade policy of other countries, which is expressed in the form of economic sanctions imposed against Russia. Retaliatory counter-sanctions from the side also have an impact. Russian government in the field of foreign trade. Thus, due to well-known political changes, the turnover in foreign trade in the country in 2014 decreased by seven percent compared to the previous year in 2013 and amounted to only eight hundred billion dollars.

As for the current stage, according to the data of the Federal customs service, the turnover in Russia's foreign trade over the past year amounted to 470 billion dollars. This figure is even lower compared to the values of 2014 and 2015. If we compare the current trade turnover with previous years, the drop is more than eleven percent. One of the important components of foreign trade policy is export from Russia to China.
The decisive role in the negative change in indicators was played by last year's devaluation of the ruble, which occurred after a large-scale drop in oil prices in early 2016. Then oil quotes fell to below $30 per barrel due to excess supply on the foreign market. The reduction in demand for oil from one of Russia's most important partners, China, also had an effect. And the exchange rate of the dollar against the ruble increased sharply against the background of all this.
Export records of recent years
At the end of last year, Russian exports, in terms of value expression, decreased by seventeen percent, amounting to $280 billion.
A similar picture is formed due to the fact that Russia exports abroad mainly hydrocarbons (gas and oil exports). Of course, along with the fall in their value, the total price of exports also decreased. Along with this, exports in physical terms increased. Russia during the whole last year did not reduce, but, on the contrary, increased their deliveries abroad, despite low prices.
Thus, oil exports in 2016 increased by almost seven percent to 200 million tons. But at the same time, income from it fell by eighteen percent to seventy billion dollars. The same thing happened in the export of other raw materials. Thus, in physical terms, the export of natural gas increased by thirteen percent, although already in the first half of the year its cost fell to $150 per thousand cubic meters.
Large commodity enterprises were engaged in increasing the volume of deliveries in order to maintain market share. In addition, in the conditions of devaluation, they had the opportunity to receive more revenue from exports in rubles.

The same has served as an incentive for companies in other industries. What does Russia export besides the materials mentioned above? Thus, our country has managed to increase the supply of most food products to China, and in addition, to the countries of Asia and Europe. In terms of wheat supplies last spring, Russia came out on top in the world, thus overtaking Canada and the United States.
In addition, the volume of exports of butter, meat, milk, cottage cheese and cheeses increased. Deliveries of engineering goods, as well as timber and other products, increased. This was influenced by government support. large enterprises, which was aimed at stimulating production and increasing exports. In addition, the devaluation of the ruble made it possible for Russian products to emerge victorious in competition with other countries. Russian goods were often supplied to the world market for more low prices, but it should be noted that this did not result in large losses for exporters.
So, as has been noted more than once, Russia mainly exports hydrocarbon raw materials, that is, oil, coal and gas, as well as chemical and metallurgical goods, along with machinery, equipment, weapons and food (grain exports, for example).
At the end of 2009, we were in second place in the world in terms of oil exports and were leaders in natural gas supplies. In the same year, seventeen billion kilowatts of electricity worth eight hundred million dollars were exported.

Jewelry
Yakutia occupies a leading position in the Russian Federation in terms of diamond mining. The countries of the European Union, Israel and the United Arab Emirates are considered one of the main importers of Yakut diamonds.
Arms export
Between 1995 and 2001, Russian arms exports amounted to approximately three billion annually. Later, it began to grow and in 2002 exceeded $4.5 billion. In 2006, this figure increased by another two billion dollars.
In 2007, on the basis of a presidential decree, Rosoboronexport became the sole state intermediary in the field of military-technical cooperation. As for arms manufacturers, they have lost the right to export the final products of Russian weapons. The share of our country in the world arms market in 2005-2009 was 23 percent, second only to the United States.
In 2009, Russia had military-technical cooperation with more than 80 countries, supplying products to 62 of them. The volume of domestic exports of military goods then exceeded two hundred and sixty billion rubles. The share of exports of combat aircraft at that time amounted to forty percent of the total exports of the main types of weapons.
What does Russia export today?
Today, Russia has multibillion-dollar arms supply contracts with countries such as India, China, Vietnam, Greece, Iran, Brazil, Syria, Malaysia, Indonesia and others.
Food export
At the beginning of 2010, we were in third place in the world in the export of grain crops, behind only the United States and the European Union. In terms of wheat exports, Russia was in fourth place. it good performance for exported agricultural products.

Last year, food exports increased by four percent, reaching an all-time high of $17 billion. Thus, in the structure of exports, the largest part of it falls on wheat, which is 27 percent of the total food supply, which allowed Russia to come out on top. Next comes frozen fish, sunflower oil and corn. By the way, according to the results of last year, the export of agricultural products and foodstuffs from Russia increased by 4%.
Export of machinery and equipment
In 2009, equipment and machinery worth eighteen billion dollars were exported from our country. From 1999 to 2009, the share of total exports of domestic machinery and equipment increased by 2.5 times. In 2010, exports of machinery and equipment increased to $21 billion.
Car export
In 2009, about 42,000 cars and 15,000 trucks worth $630 million were exported from Russia. A significant part of the trucks exported from our country is supplied to the CIS.
Export of metallurgical products
According to 2007 data, Russia ranked third in the world right after Japan and China in terms of exports of steel products, which amounted to 27 billion tons per year. In 2008, we ranked first in the world in nickel and aluminum exports.

Software export
In 2011 general indicators export volume software and services for its development amounted to four billion dollars.
Export: Russia's trading partners
Now in the world media, as well as on the Internet, it is widely discussed that Russia supposedly does not have any serious foreign trade policy, and that domestic trade directly is very, very modest. But is it really so? According to statistics from the Federal Customs Service, last year our total trade turnover amounted to $280 billion. At the same time, the share of exports is 170 billion dollars. In any case, based on statistical data, we can confidently say that we sell much more than we buy.
It must be noted, however, that the trade turnover has decreased by eighteen per cent. And it is difficult to do anything about it, given the unfavorable economic situation along with sanctions and constant foreign policy pressure. Of course, all this seriously harms the joint foreign trade business. At the same time, it should be noted that exports decreased by twenty-five percent. And yet, with whom is Russia trading today?
So, the main trading partners of our country, even despite all kinds of sanctions, are still the countries of the European Union, which amounts to 124 billion dollars a year. Trade turnover with representatives of the Eurasian Union on this moment is only nine billion, but it must be emphasized here that this is only so far.
Export to China from Russia is important aspects foreign trade policy. Trade turnover with this country is almost forty billion dollars. In second place today is Germany - it's twenty-four billion. The third position among the most promising trading partners for us belongs to the Netherlands. Therefore, trading with Russia is more than profitable, and in this regard, quite a few countries have not reduced the volume of trade with us, but rather, on the contrary, increased it. For example, countries such as China, the Netherlands and France have done this.
The table below shows the main partner countries with which Russia has foreign trade relations in terms of exports to date.
Name of partner country | Exported goods |
Ferrous metallurgy products, equipment and components, machines |
|
Oil products, precious metals |
|
Military equipment and weapons |
|
hydrocarbons, military equipment and armaments, electricity, precious metals, non-alloyed steel |
|
Military equipment and weapons, vehicles |
|
Hydrocarbons, mineral fuels, chemical industry products, metals, equipment and machines |
|
Germany | Mineral products, precious metals, hydrocarbons, chemical products, non-alloy steel |
Netherlands | Mineral products, precious metals, energy carriers, hydrocarbons |
What has changed in 2017?
After, one might say, a disastrous 2016, the situation in terms of Russian exports turned to growth again. The main stimulus in the first half of the year was the stabilization of commodity prices along with the strengthening of the ruble exchange rate and production growth rates.

In the first half of 2017, foreign trade turnover continued to increase. In six months, they reached $270 billion compared to the same period last year in 2016. Thus, there was an increase of 28 percent.
In addition, positive changes in the field of foreign trade, which began in the second half of last year, continued in 2017. The decisive factor for this was the rise in oil prices, which happened after the agreements between the OPEC countries aimed at reducing the rate of extraction of black gold. As a result of all this, since the autumn of 2016, oil prices began to increase and in February 2017 they managed to reach their maximum level: a barrel of oil exceeded $56. In May of this year, the oil producers extended the agreement for another nine months, that is, until the end of March next year 2018. According to the forecasts of most experts, this agreement will support the cost of oil until the end of this year. At the same time, the reduction volumes remain at the level of 1.8 million barrels per day. According to the cartel member countries, this will make it possible to eliminate excess supply from the market and prevent prices from falling again.
It is important to note that, along with oil prices, other commodities, such as ferrous and non-ferrous metals, as well as commodities and gold, also rose in price. By the way, do not forget about the export of grain to Asian countries. In addition, following the increase in prices, the ruble began to strengthen.
We also recommend
 Social groups, their classification
 Modern methods of personnel search and selection Methods of personnel selection in recruitment agencies
 Key steps and procedures for valuation Applying the cost approach to valuation
 Application and composition of napalm
 Jet propulsion in nature and technology Examples of the use of jet propulsion in nature
 How to organize a farm from scratch: the nuances of starting an agribusiness Agro-industrial business