Genetic mapping principles and methods of genetic mapping. Modern methods of genome mapping. Integral Intelligence: Mapping the Patterns of the Human Hive
Slide 1
Completed by: Golubeva Yu.V. 410g
Slide 2
One of the main tasks of modern genetics
is to clarify the nature of complex
signs, which include in particular
many common human diseases and
productivity characteristics
farm animals. Starter
step towards resolving this issue
is
Slide 3
Gene mapping -
Slide 4
Strategic approaches
to genome mapping
Slide 5
Direct strategy
genetics
Differences in timing of appearance
necessary methodological base and
range of possibilities. Gene function
known at least partially.
Slide 6
Functional
mapping
Basis - having some information about
biochemical polymorphism lying in
based on one or another hereditary
sign.
begins with isolation in its pure form
protein product of a gene.
to it by amino acid sequence
select degenerate primers
carry out PCR screening
Slide 7
Most genes whose function
was known, already cloned and
localized.
Slide 8
For most genes that
were localized, characteristic
structural abnormalities (such as
usually these are the genes responsible for
hereditary diseases
person), which is essential
facilitates the final stage
gene search - isolation and
gene localization.
Slide 9
Candidate
mapping
information about functional
change is not complete enough to
pinpoint the gene
There is enough information to
to make assumptions about
possible candidates or according to their
functions, or by position on
chromosome
Slide 10
General:
with functional, and with
candidate cloning approach
gene, as a rule, precedes it
precise localization in the genome
to localize a gene means to go through the path
from its function to localization on
chromosome (positions)
Slide 11
Reverse strategy
genetics
From chromosome map to function
gene. Arose thanks to the appearance in
late 80s
highly polymorphic DNA markers
Slide 12
Positional
mapping
localization of a gene in the absence of any
functional information about it
The location of the gene on the map is determined by
the results of the analysis of its linkage with
previously localized genetic
markers, further investigated
region of the genome near the marker
Slide 13
Genetic marker
(genetic marker)
The gene that determines
distinct
phenotypic trait
used for
genetic mapping
and individual
identification of organisms
or cells. Also as
genetic markers
whole ones can serve
(marker) chromosomes.
Slide 14
Minuses
positional limitation
approach is low
resolution
genetic maps - interval between
two adjacent markers, in
in which the gene is localized may
be too big and
inaccessible to physical
mapping.
Slide 15
Gene Mapping –
kinds
Physical mapping
Genetic mapping
Cytogenetic (cytological)
mapping
Slide 16
Physical
mapping
an extensive group of methods that allows you to build
genome maps (usually called physical maps)
high level of resolution and determine
distances between localized nucleotides
sequences with an accuracy of several
tens of thousands of bp up to one nucleotide pair.
Example: mapping
genes using
chromosomal mutations
Slide 17
Types of physical
mapping
restriction mapping
RH mapping
cloning in YAC (from the English yeast artificial
chromosome)
BAC (from the English bacterial artificial
chromosome) in cosmids, plasmids and
other vectors and contig mapping on
their basis
DNA sequencing
Slide 18
In the case when it is known
DNA sequence of interest
locus, this sequence can be
use for hybridization with
chromosomes in situ, and the site of hybridization
will clearly indicate localization
locus in a certain area of a certain
the same chromosomes
Slide 19
Genetic
mapping
mapping based
based on classical methods
genetics - definition
clutch groups, frequencies
recombination and
building genetic
maps, where by one
measurements serve
recombination percentages
Slide 20
First human gene
was localized on
X chromosome in 1911
G.
First autosomal
gene - only in 1968
Slide 21
Genetic map
(genetic map
Mutual scheme
gene location on
chromosome (in the group
clutch) and their
distribution by
different chromosomes
usually,
including data on
relative
removing genes from each other
friend (genetic
distances).
Slide 22
Genetic map
American mink
includes 127 genes
(black text) and 39
microsatellite
sequences
(text in red).
Different colors
areas highlighted
mink chromosomes
homologous
chromosomal.
Slide 23
Advantages
large number of conservative groups
clutch
creation of cell culture banks
to localize newly emerging
there are currently mutations
a set of marker genes for each
chromosomes.
Slide 24
Construction
genetic map
Step 1: Forming groups
linkage of genes and their study
mutual arrangement(Crossing
carried out until it is possible to identify
concatenated inheritance of the analyzed
mutations with marker mutations of any kind
chromosomes)
Step 2: Calculate the distance
between the gene under study and already
known marker genes
Slide 25
Units
Genetic distance between linear
located genes, expressed as a percentage
recombination -
Two genes on a chromosome
are at a distance of 1
cm, if probability
recombination between them
during the process of meiosis
is 1%.
Morgan's classic example -
distances between genes
fruit flies
Slide 26
4 degrees of reliability
localization of this gene
confirmed (installed in two and
more independent laboratories or
material from two or more independent test objects),
preliminary (1 laboratory or 1
analyzed family),
contradictory (data discrepancy
different researchers)
doubtful (not specified
final data from one laboratory)
Slide 27
Minuses:
recombination frequency in
different points of the genome
different, and the distance
may significantly
vary
Necessary
thorough
analysis
pedigree
(If
gene mapped
diseases)
as a result of the card
clutches do not reflect
real physical
distances between
markers and genes
on chromosomes.
Slide 28
Cytogenetic
mapping
carried out using
cytogenetics methods, when for
localization of any
nucleotide
sequences and
determining their mutual
locations are used
cytological preparations
Slide 29
Cytological cards
The cytological map method is based on
use of chromosomal rearrangements –
overlapping deletions.
When exposed to radiation and exposure to others
mutagens in chromosomes are often
losses (deletions) are observed
or insertions (duplications)
small fragments,
comparable in size to one
or several loci.
Slide 30
Principles:
Heterozygotes for chromosomes are used, one of which
will carry a group of successive dominant
alleles, and homologous to it - a group of recessive alleles of the same
genes.
If there is a loss in a chromosome with dominant genes
individual genes, for example DE, then a heterozygote ABC/abcde will have
recessive traits appear de. Based on this principle
overlapping deletion method used in construction
cytological cards.
Slide 31
Methods
differential
staining allows
identify on
drug as a separate
chromosome or any
chromosome region
Developed on Drosophila
special method
overlapping deletions was
used for
cytological mapping
genes in representatives of many
species.
Slide 32
Chromosome complexes of the Chinese hamster
(A), mice (B) and their somatic hybrid (C)
Slide 33
Comparison of genetic and
cytological maps of chromosomes
shows their correspondence:
the higher the percentage
crossing over separates a couple
genes, the more physical
the distance between them.
Slide 34
Localization Record
gene
According to the officially approved nomenclature
(ISCN,1978), each human chromosome after
differential coloration can be divided into
, numbered starting from
centromere up (
), or down
).
in every
the plot is also numbered in a similar order. Large
stripes are divided into smaller ones
Slide 35
Slide 36
Solution algorithm
mapping tasks
genes
Slide 37
Example:
Map the chromosome
containing genes if
crossover frequency between
genes and is equal to 2.5%, and -
3.7%, and -6%, and - 2.8%, and -
6.2%, and - 15%, and - 8.8%
Slide 38
Slide 39
Used
literature
E. R. Rakhmanaliev, E. A. Klimov, G. E. Sulimova METHODS
MAPPING GENOMES OF MAMMALS.
MAPPING USING RADIATION
HYBRIDS (RH MAPPING)
Aksenovich T.I. Problems of QTL Mapping (Institute
cytology and genetics SB RAS, Novosibirsk)
Myandlina G.I. Molecular basis of medical
Genetics (Department of Biology and General Genetics,
Faculty of Medicine of RUDN University)
IN AND. Ivanov Genetics Textbook for universities, 2006
 Genetic and physical maps According to the generally accepted classification, genome mapping methods are divided into two categories: p Genetic mapping p Physical mapping 2
 Drawing up genetic maps p p Markers are the positions of any distinctive features. Genes that define easily distinguishable phenotypes have been used as markers for decades. For more complex maps, its biochemical characteristics were used as phenotypic characteristics of an organism. A gene-based map may not be very detailed. Also, only a fraction of the total number of genes exists in conveniently distinguishable allelic forms. 3
 DNA markers DNA markers are mapped features that are not genes. Any useful DNA marker must have two alleles, just like a marker gene. Three types of DNA sequence features satisfy this requirement: - Restriction fragment length polymorphisms (RFLP); -Simple sequence length polymorphisms (SSLP); -Single Nucleotide Polymorphisms (SNPs). 4
 1 DNA marker. RFLP restriction length polymorphisms are the first type of DNA marker to be fully studied. Restriction enzymes cut DNA at specific recognition sites. This specificity means that treating a DNA molecule with a restriction enzyme should produce the same set of fragments. This does not always happen with genomic DNA molecules, since some restriction sites are polymorphic and exist in the form of two alleles: one shows the correct sequence for the restriction site and is therefore cut by an enzyme when the DNA is processed, and the second allele carries a modification of the sequence so that the restriction site is no longer is identified. As a result, two adjacent restriction fragments 5 remain bound together, which


 RFLP Imaging 2. PCR is used much more frequently. PCR primers are designed to anneal to both sides of the polymorphic region, and the RFLP is typed by treating the propagated fragment with a restriction enzyme and then running the sample on an agarose gel. 8
 2 DNA marker. Simple sequence length polymorphisms SSLP - sets of repeated sequences that show changes in length; different alleles contain different numbers of repeat units. There are two types of SSLPs: minisatellites and microsatellites. Two variants of some STR (microsatellite) with the repeat sequence GA 9
 Types of SSLP Minisatellites (variable number of tandem repeats, or VNTR). The repeat unit can be up to 25 bp long. 2. Microsatellites (simple tandem repeats, or STRs). Repeat element – 13 bp. or less. 1. 10
 Types of SSLP DNA markers based on microsatellites are more popular than those based on minisatellites for two reasons: - Minisatellites are unevenly distributed throughout the genome, more often found in telomeric regions at the ends of chromosomes, microsatellites are more evenly distributed throughout the genome. -accurate typing of length polymorphism by PCR is possible with sequence lengths of no more than 300 bp. , and most minisatellite alleles are 11
 3 DNA marker. Single nucleotide polymorphisms SNPs are genomic positions in which some individuals have one nucleotide, such as G, and others have a different nucleotide - P. 12
 Most SNPs have 2 alleles because SNPs occur when point mutations occur in the genome, converting one nucleotide to another. If such a mutation occurs in reproductive cells, then one or more of its descendants may inherit the mutation, and eventually the SNP becomes fixed in the population. 13
 SNP typing methods Methods are based on analysis by hybridization of oligonucleotides. - DNA chip technology - Solution hybridization methods - Oligonucleotide ligation analysis (OLA) - Thermostable mutation propagation system, or ARMS test. 14
 SNP typing methods DNA chip technology DNA intended for testing, labeled with a fluorescent marker, is pipetted onto the surface of a 2 cm 2 glass plate containing many different oligonucleotides. Hybridization is detected by analyzing the chip using a fluorescence microscope. The positions at which the fluorescent signal is emitted indicate which oligonucleotides 1. 15
 SNP typing methods 2. Solution hybridization method A pair of labels is used, which includes a fluorescent dye and a substance that quenches the fluorescent signal when it approaches the dye emitting it. The dye is attached to one end of the oligonucleotide, and the quenching agent is attached to the other end. If hybridization occurs between the oligonucleotide and the test DNA, then this base pairing is disrupted, the quencher is detached from the dye, and it produces a fluorescent signal. 16
 SNP typing methods 3. Nucleotide ligation analysis (OLA) Uses two oligonucleotides that anneal adjacent to each other, with the 3' end of one of them exactly falling into the SNP. This oligonucleotide forms a fully base-paired structure if one version of the SNP is present in the template DNA, and when this happens, this oligonucleotide can be 17
 SNP typing methods 4. Thermally stable mutation propagation system (ARMS test) The control oligonucleotide is one of a pair of PCR primers. If the control primer anneals to the SNP, then it can be continued by Taq polymerase and PCR can take place, but if it does not anneal because an alternative version of the SNP is present, then no PCR products will be produced.
 Linkage of genetic traits Genetic mapping is based on the laws of heredity described by Gregor Mendel back in 1865. In addition to Mendel's first two laws, there are two more cases of unusual linkage: - Incomplete dominance (the heterozygous form exhibits a phenotype intermediate between two homozygous forms); -Codominance (heterozygous form shows both homozygous phenotypes) 19
 A defining step in the development of genetic mapping When Mendel's laws were rediscovered in 1900, it was found that the complete linkage that was expected between many pairs of genes did not occur. Pairs of genes were either inherited independently or showed only incomplete linkage: sometimes they were inherited together, sometimes separately. p The resolution of this contradiction was a decisive step in the development of genetic mapping. p 20
 Reasoning by Thomas Morgan Incomplete linkage is explained by the behavior of chromosomes during meiosis. p The process of crossing over (or recombination) was discovered by the Belgian cytologist Jansen in 1909 and helped Morgan explain incomplete linkage. Consider the effect that crossing over has on the inheritance of genes. p 21
 Crossing-over effect There are two possible scenarios: p No crossing over occurs between genes A and B. Then two gametes have the genotype AB, the other two have the genotype ab. p Crossing over occurs between genes A and B. This results in the exchange of DNA segments between homologous chromosomes. As a result, each gamete has a different genotype from the others: AB, a. B, Ab and ab. In addition to gametes with parental genotypes, gametes with 22
 Genetic Mapping When Morgan explained incomplete linkage as crossing over, he invented a way to map individual gene positions on a chromosome. Let us assume that crossing over is a random event, which means it can occur at any position along a pair of chromatids stretched one along the other. If this is true, then two genes that are close to each other will be separated by crossing over less often than genes that are further apart. The frequency with which genes are separated by crossing over will be directly proportional to their distance from each other. Therefore, the recombination frequency is a measure of distance 23
 Linkage analysis of genetic traits in organisms of various types. Includes three situations: p Linkage analysis of genetic traits in species like the fruit fly and mouse with which crossing experiments can be performed; p Analysis of the linkage of genetic traits in people with whom experiments cannot be carried out, but pedigrees can be studied; p Linkage analysis of genetic traits in bacteria that are not 24
 Linkage analysis of genetic traits with the possibility of crossing. The method is based on the analysis of offspring from experimental crosses with known genotypes of the parents. Test crossing is usually used. This method is applicable to all eukaryotes, but is not applicable to humans for ethical reasons. 25
 Drawing up a genetic map based on the analysis of a person's pedigree Often, due to compliance with scientific and medical ethics, scientists can operate with only meager data, since marriages rarely provide convenient analytical crosses, and the genotypes of many family members may be unknown due to death or unwillingness to cooperate. Usually, in order to solve the necessary genetic problem, it is enough to additionally know the genotype of at least one relative, but for various reasons this is impossible. 26
 Compiling genetic maps of bacteria The main difficulty is that bacteria are haploid and do not undergo meiosis. Therefore, three methods are used that can cause crossing over: p During the process of conjugation, an episome is transferred (a segment of chromosomal DNA up to 1 million bp long) p Transduction (transfer of a DNA fragment up to 50 thousand bp long through a bacteriophage) p Transformation (recipient cell 27
 Drawing up physical maps A map obtained solely by genetic methods will not be completely accurate. This is due to the following reasons: 1. The resolution of the genetic map depends on the number of crossovers that were recruited. For microorganisms this is not a major problem, since they can be obtained in any quantity. The problem with humans and other eukaryotes is that it is impossible to obtain large numbers of descendants, since only 28 can be studied
 Making physical maps 2. Genetic maps have limited accuracy. The picture shows a comparison of the physical and genetic maps of the yeast Saccharomyces cerevisiae. The comparison shows that the order of the top two markers on the genetic map is incorrect and there are also differences in relative 29

 Compiling restriction maps The simplest way to compile a restriction map is to compare the sizes of fragments obtained by digesting a DNA molecule with two different restriction enzymes. Selecting the only correct map allows additional processing of the original DNA with one enzyme, preventing digestion from proceeding to completion. This is called partial restriction. The scale of the restriction map is limited by the length of the restriction bands. Restriction mapping is more suitable for small molecules. 31
 Compilation of restriction maps Is it possible to use restriction analysis to map genomes larger than 50 thousand bp? ? Yes, the restrictions of restriction mapping can be relaxed by selecting enzymes that have rare cutting sites in the target DNA molecule (“low-cutting restriction enzymes”) 32
 OFAGE method Gel electrophoresis with orthogonally alternating field. Thus, each change in the field forces the molecules to rearrange themselves, the short molecules rearrange themselves and the electric field alternates migrating through the gel between the two pairs faster than the long ones. Due to the electrodes, each of which allows this technique to be placed at an angle of 45° to the longer fragments, the longitudinal line of the gel. than with conventional electrophoresis. Methods of this kind also include CHEF - gel electrophoresis with uniform electric fields and 33 FIGE - field reversal gel electrophoresis.
 Direct observation of restriction sites in DNA molecules. Methods other than electrophoresis can be used to map restriction sites. p Optical mapping method: the positions of restriction sites are determined by directly observing cut DNA molecules under a microscope. To fix the DNA on a glass slide, gel pulling and combing of the molecules are used. p For gel pull-down, chromosomal DNA is suspended in molten agarose and placed on a microscope slide. As the gel cools and hardens, the DNA molecules stretch out. p For combing, DNA fibers are prepared by dipping a silicone-coated coverslip into the DNA solution and keeping it there for 5 minutes. Next, remove the glass from the solution. The force required to 34 pull the DNA through the surface meniscus causes each of them to be pulled into a line. When DNA dries

 Fluorescent in situ hybridization (FISH) In this technique, the marker is a DNA sequence that is displayed by hybridization with a fluorescent probe. An undisturbed chromosome is examined by probing it with a labeled DNA molecule. For the method to work, the DNA in the chromosome is denatured (dried on a glass slide and processed 36
 FISH in action 1. 2. Initially, the method was used with metaphase chromosomes, but their strong compaction did not allow for high-resolution maps. In 1995, a number of higher resolution FISH methods were developed. It was achieved by changing the nature of the chromosomal apparatus being studied. If metaphase chromosomes are too compressed for large-scale mapping, then we should use more elongated chromosomes. There are two ways to achieve this. Mechanically elongated chromosomes can be obtained by changing the preparation method used to isolate chromosomes from metaphase nuclei. Non-metaphase chromosomes are used because at all stages of the cell cycle, except metaphase, the chromosomes are in their natural unfolded state. Interphase chromosomes
 Sequence tagged (STS) mapping is currently the most powerful physical mapping method. Sequence tagged region, or STS, is a short DNA sequence, 100 -500 bp. in length, which is easily identified and occurs only once in the chromosome or genome being studied. To map a set of STSs, it is necessary to have multiple overlapping DNA fragments from a single chromosome or a complete genome. Which fragments contain which STS is determined by hybridization analysis, or more commonly, PCR. Any unique DNA sequence can be used as an STS. To do this, the DNA sequence must be known and the STS must have a unique location on the chromosome being studied.
 Methods for obtaining STS 1. 2. 3. Expressed sequence tags - short sequences obtained by analysis of DNA clones. Simple sequence length polymorphisms (SSLP) Random genomic sequences - obtained by sequencing random portions of cloned genomic DNA. 39
 DNA fragments for mapping using STS Otherwise mapping reagent; exist in the form of a library of clones and radiation hybrids. A radiation hybrid is a rodent cell containing fragments of the chromosomes of another organism. When a chromosome was broken into fragments, a larger dose of radiation produced a larger number of fragments. Fusion is stimulated chemically (by polyethylene glycol) or biologically by the Sendai virus. 40
 Conclusions p p p Genome maps are a reference framework for sequencing projects because they allow the accuracy of the assembled DNA sequence to be verified. Genetic maps are constructed from the results of crossbreeding experiments and pedigree analysis, while physical maps are constructed through direct observation of DNA molecules. In the very first genetic maps, markers were genes whose alleles could be easily distinguished (by sharply different phenotypes), but today DNA markers are restriction fragment length polymorphisms (RFLP), simple sequence length polymorphisms (SSLP) and single nucleotide polymorphisms (SNPs) . All of them are easily typed by PCR. Linkage analysis of genetic traits allows one to determine the frequency of recombination between a pair of markers. For many organisms, linkage analysis of genetic traits is traced through planned 41 crossing experiments. Conducting them with people
 Conclusions p p p Genetic mapping of the human genome relies on information gleaned from pedigree analysis. The low resolution of genetic maps is refined by physical mapping. In a DNA molecule, the positions of restriction sites are determined by restriction mapping. Fluorescent hybridization is more productive, in which the drug is probed with a marker labeled with a fluorescent label. The position of hybridization is determined by microscopy. The most detailed physical maps are obtained by sequence tag content (STS) mapping. The position of the marker on the map is determined by fragments from the collection containing copies of the marker. 42
KAZAKH NATIONAL UNIVERSITY NAMED AFTER AL-FARABI
Faculty: biology and biotechnology
Department: biotechnology
"ABSTRACT"
On the topic of: GENETIC LINKAGE AND MAPPING OF HUMAN GENES.
Completed : 3rd year students (med.bt.)
Nuralibekov S.Sh.
Davronova M.A.
I checked : Ph.D. , associate professor of the departmentmolecular
biology and genetics Omirbekova N.Zh.
ALMATY 2018
Genetic linkage maps………………………………………………………..3
Modern methods for constructing genetic linkage maps……..........……...….5
PCR in human genome research………………………………....………….……8
Low resolution physical maps…………………………………………..….….9
High resolution physical maps………………..………………………..………11
List of sources used………………...…………………..………………….13
Mapping and determination of the primary structure of the human genome
After a brief review of the main methods most often used in molecular genetics to study the structure and mechanisms of gene functioning, it seems appropriate, using the example of the human genome, to take a closer look at the practical application of these methods and their modifications for the study of large genomes. In order to comprehensively study the human genome, this colossal repository of genetic information, a special international program “Human Genome Project” has recently been developed and is being implemented. The main goal of the program is to construct comprehensive, high-resolution genetic maps of each of the 24 human chromosomes, which should ultimately culminate in determining the complete primary DNA structure of these chromosomes. Currently, work on the project is in full swing. If it is successfully completed (and this is planned to happen in 2003), humanity will have prospects for a thorough study of the functional significance and mechanisms of functioning of each of its genes, as well as the genetic mechanisms that control human biology, and to establish the causes of most pathological conditions of its body .
Basic approaches to mapping the human genome
Solving the main task of the Human Genome program includes three main stages. At the first stage, it is necessary to specifically divide each individual chromosome into smaller parts, allowing their further analysis using known methods. The second stage of research involves determining the relative position of these individual DNA fragments relative to each other and their localization in the chromosomes themselves. At the final stage, it is necessary to actually determine the primary DNA structure of each of the characterized chromosome fragments and compile a complete continuous sequence of their nucleotides. The solution to the problem will not be complete if it is not possible to localize all the genes of the organism in the found nucleotide sequences and determine their functional significance. The passage of the three above stages is required not only to obtain comprehensive characteristics of the human genome, but also of any other large genome.
Genetic linkage maps
Genetic linkage maps are one-dimensional diagrams of the relative positions of genetic markers on individual chromosomes. Genetic markers are understood as any heritable phenotypic characteristics that differ among individual individuals. The phenotypic traits that meet the requirements of genetic markers are very diverse. They include both behavioral characteristics or predisposition to certain diseases, as well as morphological characteristics of whole organisms or their macromolecules that differ in structure. With the development of simple and effective methods for studying biological macromolecules, such features, known as molecular markers, have become most often used in the construction of genetic linkage maps. Before moving on to considering methods for constructing such maps and their significance for genome research, it is necessary to recall that the term “linkage” is used in genetics to denote the probability of the joint transmission of two traits from one of the parents to the offspring.
When sex cells (gametes) are formed in animals and plants at the stage of meiosis, synapsis (conjugation) of homologous chromosomes usually occurs. Sister chromatids of homologous chromosomes are connected along their entire length to each other, and as a result of crossing over (genetic recombination between chromatids), their parts are exchanged. The farther two genetic markers are located from each other on the chromatid, the more likely it is that the chromatid break required for crossing over will occur between them, and the two markers on the new chromosome belonging to the new gamete will be separated from each other, i.e. their adhesion will be broken. The linkage unit of genetic markers is the morganid (Morgan unit, M), which contains 100 centimorganids (cM). 1 cM corresponds to the physical distance on the genetic map between two markers, recombination between which occurs at a frequency of 1%. Expressed in base pairs, 1 cM corresponds to 1 million bp. (m.b.o.) DNA.
Genetic linkage maps correctly reflect the order of genetic markers on chromosomes, but the resulting distances between them do not correspond to real physical distances. This fact is usually associated with the fact that the efficiency of recombination between chromatids on individual chromosome sections can vary greatly. In particular, it is suppressed in heterochromatic regions of chromosomes. On the other hand, recombination hotspots often occur in chromosomes. Using recombination frequencies to construct physical genetic maps without taking these factors into account will lead to distortions (underestimation or overestimation, respectively) of the actual distances between genetic markers. Thus, genetic linkage maps are the least accurate of all the types of genetic maps available, and can only be considered as a first approximation to actual physical maps. However, in practice, it is they and only they that make it possible to localize complex genetic markers (for example, those associated with symptoms of a disease) at the first stages of the study and make it possible to further study them. It must be remembered that in the absence of crossing over, all genes located on an individual chromosome would be passed from parents to offspring together, since they are physically linked to each other. Therefore, individual chromosomes form gene linkage groups, and one of the first tasks in constructing genetic linkage maps is to assign the gene or nucleotide sequence under study to a specific linkage group. Next The table lists modern methods, which, according to V.A. McKusick were most often used to construct genetic linkage maps until the end of 1990.
Modern methods for constructing genetic linkage maps
| Method | Number of mapped loci |
| Somatic cell hybridization | 1148 |
| In situ hybridization | 687 |
| Family | 466 |
| Determination of dose effect | 159 |
| Restriction mapping | 176 |
| Use of chromosomal aberrations | 123 |
| Use of synteny | 110 |
| Radiation-induced gene segregation | 18 |
| Other methods | 143 |
| Total | 3030 |
Hybridization of somatic cells. One of the most popular methods for assigning a genetic marker (functionally active gene) to a specific linkage group is hybridization (fusion with each other) of somatic cells of different biological species of organisms, one of which is the one being studied. In interspecies hybrids of somatic cells, during the cultivation process, the loss of chromosomes occurs mainly from one of the biological species. The loss of chromosomes is usually random, and the resulting cell clones contain the remaining chromosomes in different combinations. Analysis of clones containing different sets of chromosomes of the species under study makes it possible to determine which of these remaining chromosomes is associated with the expression of the marker under study, and, therefore, to localize the gene on a specific chromosome.
In situ hybridization. The in situ hybridization method is also widely used to map nucleotide sequences on chromosomes. For this purpose, preparations of fixed chromosomes are hybridized (incubated at elevated temperatures followed by cooling) with the nucleotide sequences under study, labeled with a radioactive, fluorescent or other label. After washing off the unbound label, the remaining labeled nucleic acid molecules become associated with chromosomal regions containing sequences complementary to the labeled nucleotide sequences under study. The resulting hybrids are analyzed using a microscope either directly or after autoradiography. This group of methods is characterized by a higher resolution than somatic cell hybridization, since they allow the localization of the studied nucleotide sequences on chromosomes. As the Human Genome Program progresses, more and more isolated nucleotide sequences are becoming available to researchers that can be used as probes for in situ hybridization. In this regard, these methods have recently taken first place in terms of frequency of use. The most popular group of methods is called fluorescence in situ hybridization (FISH), which uses polynucleotide probes containing a fluorescent label. In particular, in 1996, >600 papers were published describing the use of this method.
Familial genetic linkage analysis. This group of methods is often used in medical genetics to identify the relationship (linkage) between the symptoms of a disease caused by a mutation in an unknown gene and other genetic markers. In this case, the symptoms of the disease themselves act as one of the genetic markers. A large number of polymorphisms, including RFLPs, have been found in the human genome. RFLPs are distributed more or less evenly throughout the human genome, spaced 5–10 cM apart. The closer individual polymorphic loci are located to the gene responsible for the disease, the less likely they are to separate during recombination in meiosis and the more often they will occur together in a sick individual and be transmitted together from parents to offspring. By cloning an extended section of the genome that includes the corresponding polymorphic marker (its selection from the genomic DNA library is carried out using a probe), it is possible to simultaneously isolate along with it the gene that causes a hereditary disease. Such approaches have, in particular, been successfully used to conduct family analysis and isolate relevant genes in Duchenne muscular dystrophy, cystic fibrosis of the kidneys (cystic fibrosis) and myotonic dystrophy. The information content of individual RFLPs of the human genome depends on the level of their heterozygosity in the population under study. A measure of the informativeness of RFLP as a genetic marker, according to the proposal of D. Botstein et al (1980), is considered to be the value of polymorphism information content PIC (polymorphism information content), which is the ratio of the number of crosses in which at least one of the parents has the polymorphic marker under study in a heterozygous state, to all crosses.
Determination of gene dosage effect and use of chromosomal aberrations . These methods detect correlations between the level of expression of the gene under study and the number of specific chromosomes in aneuploid cell lines or structural rearrangements of chromosomes (chromosomal mutations - aberrations). Aneuploidy is the presence of a cell, tissue, or whole organism with a number of chromosomes that is not equal to that typical for a given biological species. Chromosomal aberrations in the form of translocations of chromosome regions into heterochromatic regions of the same or other chromosomes are often accompanied by suppression of transcription of genes located in the translocated regions or in the acceptor chromosome (mosaic position effect).
Use of synteny. Synteny is the structural similarity of gene linkage groups in organisms of different biological species. In particular, several dozen syntenic groups of genes are known in the human and mouse genomes. The presence of the phenomenon of synteny makes it possible to narrow the search for the location of the gene under study on chromosomes, limiting it to the region of known genes belonging to a specific syntenic group.
Gene segregation induced by ionizing radiation. Using this method, the distance between the genes under study is determined by estimating the probability of their separation (segregation) after irradiation of cells with a certain standard dose of ionizing radiation. Irradiated cells are saved from death by hybridization with somatic cells of rodents, and the presence of the studied markers of irradiated cells in somatic hybrids in culture is determined. As a result, it is possible to draw a conclusion about the presence or absence of linkage (physical distance) between these genes.
Among other methods Mention should be made of methods based on the use of large DNA fragments for mapping genes, formed under the action of large-cut restriction enzymes. After cleavage of genomic DNA, the resulting fragments are separated by electrophoresis in a pulsed electric field and then they are Southern hybridized with probes corresponding to the mapped genes. If, after hybridization, the signals of both probes are localized on the same large DNA fragment, this indicates a close linkage of such genes.
PCR in human genome research
The polymerase chain reaction occupies a central place in the development of approaches to the practical implementation of the Human Genome Program. As discussed above, PCR can quickly and efficiently amplify almost any short region of the human genome, and the resulting PCR products can then be used as probes to map corresponding regions on chromosomes by Southern or in situ hybridization.
STS concept. One of the key concepts underlying the human gene mapping program under discussion is the concept of sequence-tagged sites (STS). According to this concept, all DNA fragments used to construct genetic or physical maps can be uniquely identified by a 200–500 bp nucleotide sequence that will be unique to that fragment. Each of these sites must be sequenced, which will make it possible to further amplify them using PCR and use them as probes. The use of STS would make it possible to use their sequences in the form of PCR products as probes for the targeted isolation of any DNA fragment of a particular genomic region from a library of genomic sequences. As a result, databases can be created that include the location and structure of all STSs, as well as the primers necessary for their amplification. This would eliminate the need for laboratories to store numerous clones and send them to other laboratories for research. In addition, STS provide the basis for the development of a common language in which different laboratories can describe their clones. Thus, the end result of developing the STS concept would be a comprehensive STS map of the human genome. Theoretically, to construct a genetic map 1 cm in size, 3000 fully informative, polymorphic DNA markers are needed. However, since polymorphic markers are unevenly distributed in the genome and only a few of them are fully informative, the actual number of markers required to construct a map of this size is estimated at 30–50 thousand. To obtain markers corresponding to the chromosome regions under study, primers corresponding to dispersed repeating sequences are now often used, among which Alu sequences were the first to be used.
Alu-PCR. Dispersed repeating Alu sequences are characteristic of the human genome. Primers specific for Alu sequences are used to amplify DNA regions of the human genome located between Alu repeats, which are located on average at a distance of 4–10 kb. from each other. Another option for Alu-PCR is the targeted synthesis of DNA probes to chromosome regions obtained after laser fragmentation, individual chromosomes isolated using flow cytometry, or DNA of hybrid cells containing a certain part of the human genome. In addition, Alu-PCR is used to obtain unique fingerprints characterizing cell hybrids in terms of the stability of their genome, as well as to characterize human DNA fragments cloned in YAC vectors, cosmids or vectors based on bacteriophage DNA. The uniqueness of Alu sequences for the human genome makes it possible to use them for “walking along chromosomes”, as well as for expanding existing contigs. Since >90% of the moderately repetitive sequences in the human genome are represented by the Alu and KpnI families, it is not surprising that the latter are also used in PCR for the same purposes as Alu. However, here the profiles of PCR products are less complex, since KpnI sequences are repeated less frequently in the genome and have a characteristic localization in chromosomes.
PCR is actively used to identify polymorphic molecular markers in the construction of genetic linkage maps, the basic principles of which were discussed above. This method also proves useful in DNA sequencing and in constructing high-resolution physical maps of the human genome. The last two areas of application of PCR will be discussed in more detail below.
Low resolution physical maps
Unlike the genetic linkage maps discussed above, physical maps of the genome reflect the actual distance between markers, expressed in base pairs. Physical maps vary in their degree of resolution, i.e. according to the details of the genome structure that are presented on them. A comprehensive physical map of the human genome of maximum resolution will contain the complete nucleotide sequence of all its chromosomes. At the other extreme of physical maps with minimal resolution are chromosomal (cytogenetic) maps of the genome.
Four types of genomic DNA genetic maps and their relationships

1 – genetic linkage map, 2 – physical restriction map, spaces indicate sites of DNA cleavage by restriction enzymes, 3 – physical map of contigs, showing overlapping DNA clones obtained using YAC vectors, 4 – comprehensive physical map in the form of DNA nucleotide sequences. All maps show the same chromosome region
Chromosome maps. Chromosomal maps of the human genome are obtained by localizing genetic markers on individual chromosomes using cytogenetic methods, including autoradiography and FISH. In the last two cases, radioactive or fluorescent labels associated with the studied genetic loci of intact chromosomes are detected using light microscopy. More recently, chromosomal maps made it possible to localize the DNA fragment under study on a chromosomal section with a length of 10 Mb. Modern methods of in situ hybridization using metaphase chromosomes, mainly the FISH method, localize polynucleotide markers within 2–5 Mb. Moreover, during in situ hybridization with interphase chromosomes, in which the genetic material is in a less compact form, the resolution of chromosome maps approaches 100 kb.
The accuracy of chromosome maps is also increased using modern genetic methods. For example, the ability of PCR to amplify DNA segments of a single sperm allows the study of a large number of meioses, as if conserved in individual sperm samples. As a result, it becomes possible to check the relative position of genetic markers localized on chromosomal maps using more crude methods.
cDNA maps. cDNA maps reflect the position of expressed DNA regions (exons) relative to known cytogenetic markers (bands) on metaphase chromosomes. Since such maps provide insight into the localization of transcribed regions of the genome, including genes with unknown functions, they can be used to search for new genes. This approach is especially useful when searching for genes whose damage causes human diseases, if the approximate localization of such chromosome regions has already been previously carried out on genetic linkage maps as a result of family genetic analysis.
High resolution physical maps
Two strategies for constructing physical maps of DNA
a – “top-down” strategy: the DNA of the whole chromosome is cleaved by large-cut restriction enzymes, and a restriction map is constructed for each of the individual DNA fragments; b – bottom-up strategy, individual YAC clones after identification are combined into contigs
In attempts to construct high-resolution maps of the human genome, two alternative approaches, called top-down mapping and bottom-up mapping, are being experimentally implemented. When mapping from top to bottom, the starting point in the analysis is the DNA sample of an individual human chromosome. DNA is cut by large-cut restriction enzymes (for example, NotI) into long fragments, which, after separation by electrophoresis in a pulsed electric field, are subjected to further restriction analysis with other restriction enzymes. As a result, a macrorestriction map is obtained, which fairly fully represents all the sequences of the chromosome under study or its parts, but its resolution is low. It is very difficult to localize individual genes on such a map. In addition, each individual map rarely covers extended DNA segments (usually no more than 1–10 Mb).
When mapping the human genome from bottom to top, based on a preparation of the total DNA of the genome or an individual chromosome, a series of random clones of extended DNA sequences (10–1000 kb), some of which overlap with each other, are obtained. Bacterial artificial minichromosomes (BAC) or yeast artificial chromosomes (YAC), described in detail in section 7.2.4, are often used as a cloning vector in this case. A series of partially overlapping and complementary clones forms a continuous contiguous sequence of DNA nucleotides, called a contig. The correctness of the obtained contigs is confirmed by in situ hybridization (FISH) with their simultaneous binding to certain regions of the chromosomes under study. Contig-based maps provide complete information about the structure of individual chromosome segments and allow the localization of individual genes. However, such maps are difficult to use for the reconstruction of entire chromosomes or their extended sections due to the lack of corresponding clones in the available gene library.
The main problem that has to be solved when using both approaches to constructing high-resolution physical maps is the combination of scattered DNA fragments into continuous nucleotide sequences. Most often, special cloned DNA fragments, called linking clones, are used for this. DNA fragments from linking clones contain in their internal parts the nucleotide sequences of large-cut restriction enzymes and, therefore, represent the docking sites for DNA fragments used in the first stages of physical mapping. Southern hybridization, which uses DNA fragments of connecting clones as probes, determines DNA fragments of physical maps containing nucleotide sequences in the vicinity of restriction sites of large-cut restriction enzymes. If two such fragments are found, then the corresponding linking clone overlaps and is part of both of these fragments. Binding clones, in turn, are selected from gene libraries using probes, which are nucleotide sequences of restriction sites of large-cut restriction enzymes.
LIST USED SOURCES
1) Clark M.S. Comparative genomics: The key to understanding the Human Genome Project // BioEssays. 1999. Vol. 21. P. 21–30.
2) Billings P.R., Smith C.L., Cantor C.L. New techniques for physical mapping of the human genome // FASEB J. 1991. Vol. 5. P. 28–34.
3) Georgiev G.P. Genes of higher organisms and their expression. M.: Nauka, 1989. 254 p.
4) http://referatwork.ru/refs/source/ref-8543.html
Gene mapping- determination of the position of a given gene on a chromosome relative to other genes. Three main groups of gene mapping methods are used - physical (determination using restriction maps, electron microscopy and some variants of electrophoresis of intergenic distances - in nucleotides), genetic (determination of recombination frequencies between genes, in particular, in family analysis, etc.) and cytogenetic ( in situ hybridization, production of monochromosomal cell hybrids, deletion method, etc.). In human genetics, 4 degrees of reliability of the localization of a given gene are accepted - confirmed (established in two or more independent laboratories or on the material of two or more independent test objects), preliminary (1 laboratory or 1 analyzed family), contradictory (discrepancy in data from different researchers), doubtful (not definitively specified data from one laboratory).
Genetic mapping involves determining distances based on recombination frequencies between genes. Physical mapping uses some molecular genetics techniques to determine distances in nucleotides. Genetic mapping is the determination of the linkage group and the position of the mapped gene relative to other genes on a given chromosome.
The more genes known in a given species, the more accurate the results of this procedure. As a rule, the number of genes in linkage groups depends on the linear dimensions of the corresponding chromosomes. However, extended regions of constitutive heterochromatin (in the region of the centromere and telomeric regions) contain practically no genes and, thus, violate this dependence.
At the first stage of mapping, the belonging of a gene to one or another linkage group is determined. As is known, D. melanogaster has a diploid set of four pairs of chromosomes: the first pair are sex chromosomes (XX in females, XY in males), the second, third and fourth are autosomes. The number of genes on the Y chromosome of males is very small. To localize a newly occurring mutation, it is necessary to have a set of marker genes for each chromosome. Mutation mapping is based on analysis of its linkage to these markers. For example, if the mutation of interest to us is inherited independently of the markers of the second chromosome, a conclusion is made that it belongs to a different linkage group.
The importance of mapping genes, and primarily human genes, is evidenced by the creation of the International Human Genome Program, which sets itself the ambitious task of mapping all human genes and completely sequencing the entire DNA of the genome. The program is being developed in hundreds of laboratories in many countries around the world. Methods of molecular biology, cytogenetics and somatic cell genetics are used. Criteria have been developed to determine the reliability of mapping. Various levels of confidence in gene localization have been determined.
An important contribution to the development of genetics was the chromosomal theory of heredity, developed primarily thanks to the efforts of the American geneticist Thomas Hunt Morgan and his students and collaborators, who chose the fruit fly as the object of their research. Drosophila melanogaster. The study of the patterns of linked inheritance made it possible, by analyzing the results of crossings, to draw up maps of the location of genes in “linkage groups” and to compare linkage groups with chromosomes (1910-1913).
The most important task of molecular genetics in relation to medicine is the identification of genes for hereditary human diseases and the identification of specific damage in them, leading to the development of phenotypic manifestations of the disease. This task can be accomplished using several basic sub-
\ODOV.
The first approach to gene identification, which remained leading until approximately the early 90s,
| based on the available information about the main bio- 11 biological defect (the primary protein product of the gene) characterizing the disease being studied | Shishkin S.S., Kalinin V.N., ] 992; Gardner E. et al., 1991; Collins F., 1995].
I l "-transition from protein analysis to the DNA level was carried out through sequencing of the purified protein product and obtaining DNA probes, the use of monoclonal antibodies and with the help of some other methodological techniques. Chromosomal localization of the gene in this search scheme is the final result of the study. The described approach using this or that preliminary information about the functional significance of the gene being sought is called “functional cloning”. An example of the successful use of functional cloning is the identification of the phenylketonuria gene. Unfortunately, this method can be applied only to a very limited range of human diseases, whereas for the majority of hereditary diseases. primary gene products or pathognomonic biochemical markers are unknown.
Improvements in molecular technologies have led to the creation of a fundamentally different gene search strategy that does not require any prior knowledge of its function or primary biochemical product. This strategy involves identifying a gene based on precise knowledge of its localization in a specific chromosomal locus - “positional cloning” (the less successful term “reverse genetics”). Positional cloning leads to the establishment of the molecular basis of the disease “from gene to protein” and includes the following main stages: 1) mapping the disease gene to a specific region of a specific chromosome (genetic mapping); 2) drawing up a physical map of the studied chromosomal region (physical mapping); 3) identification of expressed DNA sequences in the studied region; 4) sequencing of candidate genes and identification of mutations in the desired gene in sick individuals; 5) analysis of gene structure.
deciphering the sequence and primary structure of its products - mRNA and protein. In some cases, positional cloning of a gene is facilitated when visible cygogenetic rearrangements or detectable deletions in a critical chromosomal region are detected in patients, which can significantly increase the accuracy of mapping the mutant gene. The identification of such rearrangements contributed, in particular, to the success in cloning the genes for Duchenne/Becker muscular dystrophy, neurofibromatosis type 1, tuberous sclerosis, adrenoleukodystrophy and other hereditary diseases of the nervous system.
One of the important intermediate results of the research project “Human Genome” was the creation of an increasingly rich transcriptional map of the genome, containing information about thousands of already known genes and expressed nucleotide sequences. This has contributed to the significant development of another approach to identifying the primary genetic defect, in which, after preliminary mapping of the mutant gene, suitable candidate genes located in the same chromosomal region are screened (“positional candidate approach”). This method assumes certain knowledge about the pathophysiology of the disease being studied, which makes it possible to rationally select candidate genes for analysis from a large number of genes that may be located in the “zone of interest.” Among the neurological hereditary diseases whose genes have been identified in this way through the analysis of suitable candidates in an established chromosomal interval are dopa-dependent dystonia and Friedreich-like ataxia with vitamin E deficiency. According to current forecasts, it is the analysis of “positional candidates” that will become the focus of development in the near future. the leading method for identifying genes for hereditary diseases, which is greatly facilitated by the creation and constant expansion of computer databases of expressed sequence tags.
Thus, determining the chromosomal localization of the desired gene - genetic mapping - is the first, key step towards revealing the molecular basis of a particular hereditary disease.
There are several main methods that allow you to map an unknown gene in a specific chromosomal locus: a) clinical-genealogical (the simplest and most ancient) - based on the analysis of the inheritance of traits in large pedigrees; An example is the establishment of the localization of a gene on the X chromosome in the case of transmission of the disease via an X-linked type; b) cytogenetic - based on the association of chromosomal rearrangements detected by microscopy with a certain clinical phenotype; c) the in situ hybridization method (including its modern modification - fluorescent in situ hybridization, FISH) - uses specific hybridization of mRNA and cDNA of the desired gene with denatured chromosomes on metaphase cell preparations; d) hybrid cell method - based on the analysis of joint segregation of cellular characteristics and chromosomes in hybrid somatic cells cloned in vitro [Fogel F., Motulski A., 1990; Gardner E. et al., 1991]. All these methods have found their application in modern molecular genetics, but they have serious limitations associated with both insufficient resolution and the existence of strict preconditions necessary for conducting research (such as the availability of probes, the availability of selective systems for selecting hybrid cells and etc.). The most powerful, productive and currently widely used method for mapping genes of human hereditary diseases is the so-called linkage analysis - analysis of the linkage of the desired gene with a set of precisely localized genetic markers.
The central position of linkage analysis is that a measure of the relative genetic distance between two loci on a chromosome can be the frequency of recombinations between these loci as a result of crossing over of homologous chromosomes in meiosis. The closer the loci are located on a chromosome, the greater the likelihood that they will be inherited as a single whole (linkage group); if the studied loci are significantly distant (i.e., have a weak degree of linkage), they are more likely to disperse after crossing over to different chromosomes. The frequency of recombination between loci of 1% is taken as unity
- the genetic distance between them is 1 centimorganide (cM), which is equivalent to an average of 1 million bp. It should be emphasized that the frequency of recombination and, therefore, genetic distance is not the same for men and women (more in women), for different chromosomes, as well as for different regions of the same chromosome (“recombination hot spots”).
Rice. 30. The principle of genetic linkage analysis using the example of an autosomal dominant disease. In this example, 4 linked markers A, B, C and D were studied, from which the haplotypes were reconstructed. Chromosomes of different origins are marked with different types of shading (the original mutant chromosome is indicated in black). All patients in the pedigree have the same common (middle) part of the original mutant chromosome. For example, in the lower generation, the chromosomes underwent a number of recombinations, but all sick sibs (including individuals Sh-Z and Sh-8) retain the same mutant haplotype for markers B and C (haplotype y). On the contrary, none of the healthy siblings in the lower generation inherited haplotype j from their father for markers B and C (individual Ш-4 inherited a chromosome in which recombination occurred below the critical segment). Thus, segregation of marker alleles and analysis of haplotypes indicate that the disease gene is located in a chromosomal segment that includes markers B and C. Accordingly, the outer boundaries of the chromosome region within which the mutant gene is located are markers A and D.
and the same allele of the marker under study, this indicates the absence of recombinations between the desired mutant gene and this marker, i.e. about the presence of adhesion between them. An example of linkage between the gene of an autosomal dominant disease and certain genetic markers is presented in Fig. thirty.
To reliably prove cohesion, a special mathematical apparatus has been developed. The principle of calculation is to compare the probabilities of hypotheses about the presence and absence of linkage with the available family data and the selected recombination frequency 0; the ratio of these two probabilities (likelihood ratio) expresses the odds for and against linkage. For convenience, the decimal logarithm of the likelihood ratio is used - Logarithm of the Odds, or LOD:
Po
LOD = Logio --
P1/2, where P is probability
the resulting distribution of family data for linked genes with a recombination frequency of 0, P is the probability of such a distribution for two unlinked freely recombining genes (recombination frequency 0 = 1/2). The use of a logarithmic form of calculation allows the addition of 27od points obtained from the analysis of individual pedigrees. To prove genetic linkage, a Lod score of +3 was adopted, which means an odds ratio of 1000:1 in favor of the presence of genetic linkage between gt; marker and the characteristic being studied. Lod score -2 and below indicates a significant lack of coupling; Lod-score values from +3 to - 2 are, accordingly, more or less presumptive from the point of view of the presence of adhesion and require further confirmation. Recombination frequency 0, for which the maximum L od score was identified, is a reflection of the most probable genetic distance between the studied loci; It is approximately believed that 1% of recombinations indicates very close linkage, a recombination frequency of about 5% indicates good linkage, and a frequency of 10-20% indicates some moderate linkage.
Calculation of Lob points involves the use of special computer software (LIPED program, LINKAGE software package, etc.).
For linkage analysis to be successful, it is necessary that the families being studied are informative about the disease and the genetic marker. The first means the presence of a sufficient number of informative meioses in the pedigree, allowing one to analyze the divergence of characters in a given pedigree. From a practical point of view, this means having a large number of sick and healthy relatives available for analysis, usually spanning several generations. Informativeness of a marker presupposes its polymorphism (i.e., the existence of a large number of alleles) and heterozygosity in key family members, which makes it possible to differentiate the genetic origin of specific marker alleles. Until the end of the 1980s, the main type of markers used in linkage analysis were sections of chromosomal DNA containing a variation in one base pair and distinguished by the presence or absence of a restriction site for the corresponding enzyme, i.e. by the length of restriction fragments (“restriction fragment length polymorphism”, RFLP). A new era in genetic mapping has begun with the discovery of a class of highly polymorphic markers, which are DNA sections consisting of a variable number of copies of tandem (SA)n repeats and having extremely high heterozygosity. This made it possible to largely resolve the problem of the information content of the markers used and contributed to significant progress in linkage analysis. According to some estimates, to screen a complete haploid genome and identify genetic linkage, it is necessary to have 200-300 highly polymorphic markers evenly distributed along the chromosomes. Genetic maps of the latest generation include over 5000 such markers, which allows us to consider today the task of establishing genetic linkage as fundamentally possible in any informative pedigrees.
A serious problem encountered when conducting linkage analysis on a series of families is the problem of possible genetic heterogeneity of the clinical syndrome being studied. If the phenotype under study can be caused by mutations in different genes, the mechanical addition of positive (in the presence of linkage) and negative (in the absence of linkage) Lod-scores obtained in individual families leads to leveling of the total Lod-score value and a false conclusion about the complete absence of linkage . An example is autosomal dominant motor-sensory neuropathy type 1, caused by mutations in various genes localized on the 1st, 17th and other chromosomes. In this situation, a thorough, detailed examination of patients and families referred for linkage analysis is of particular importance in order to select the most homogeneous clinical groups. An additional way to avoid a false negative test result is to use
ta,/7od-points of the special HOMOG program or similar programs that allow assessing the probability of genetic heterogeneity for a specific set of family data. The most effective approach at the first stage of the study is linkage analysis in one large informative pedigree, which allows us to deliberately exclude the possibility of genetic heterogeneity in the studied group of patients. Additional difficulties when conducting linkage analysis are associated with the often observed incomplete penetrance and variable expressivity of the mutant gene, the presence of phenocopies among the examined family members, assessment of the age of onset of the disease and the possibility of preclinical carriage of the mutation, assessment of the prevalence of specific alleles of the markers being studied in the population, etc. . . Incorrect accounting or underestimation of these factors can significantly affect the final result, therefore the quality of detailed clinical and genealogical analysis in the families being studied comes to the fore.
Many new methods have been developed that represent a further development of the traditional strategy for studying genetic linkage and significantly increase the speed of execution, methodological capabilities and resolution of this analysis in the localization of unknown genes of hereditary human diseases. One of these methods is multilocus linkage analysis, which allows one to estimate Lod scores for a set of linked loci in accordance with the genetic map of the chromosomal region being studied and determine the most likely localization of the mutant gene within this region. In inbred
pedigrees with an autosomal recessive disease in the presence of the assumption of a “founder effect”, the method of homozygous mapping has proven itself to be extremely productive: it consists of analyzing “homozygosUy-by-descent” and allows assessing the degree of homozygosity of affected individuals by a series of markers as a result of inheritance from a single ancestor of a common chromosomal region that includes a mutant gene. The method of “economical genome scanning” is promising, which involves the preferential use of markers localized in “strategic” CG saturated chromosomal regions rich in expressed sequences. A number of other modifications of classic linkage analysis have also been proposed.
It is important to emphasize that linkage analysis will remain important even after the identification of the entire human genome. For example, when studying a still fairly large group of hereditary diseases with unidentified genes, the first step towards elucidating the molecular defect may be genetic analysis and identification of the chromosomal locus of the disease, followed by screening for suitable genes in this region. The role of the clinician is extremely important to the success of genetic mapping. It consists of adequate selection of representative families, detailed assessment of the clinical status of all family members included in the study, accurate diagnosis of the disease and assessment of the pattern of segregation of the mutant gene, as well as addressing many other key issues.
We also recommend
 Job responsibilities of an engineer
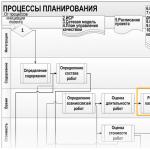 Practice of drawing up a project schedule in MS Project Plan project implementation schedule sample
 Classification of commercial real estate
 Peoples of Russia, Buryats Customs and traditions of the Buryat people presentation
 ERP systems: what is it in simple words, pros and cons of ERP, review What is needed for successful implementation of erp
 Transfer to another job at the initiative of the employer Ways to solve the problem